Marar 20, 2024 - Quote size and liquidity dry up leading into the event, and it takes several minutes to recover.
Read MoreFebr 16, 2024- We analyzed the average roll period quote size of U.S. Treasury futures calendar spreads since 2018. The quote size of U.S. 10-Year calendar spread has more than doubled since 2022.
Read MoreMar 15, 2023 - We analyze the average daily quote size and liquidity of U.S. Treasury futures amidst the Silicon Valley Bank (SVB) fall.
Read MoreSep 30, 2022 - We analyze the pairwise correlations between the most traded symbol of different asset classes and report the same as a heat map.
Read MoreMar 14, 2022 - As crude oil prices surge due to Russian sanctions, we analyze the liquidity and
top-of-the-book quote size of crude oil futures from June 2012 until now.
Feb 3, 2021 - Using high-frequency data of the last two weeks, we analyze the quote size, bid-ask spread, and CME silver and gold futures liquidity. For this analysis, we use the entire term structure. The study is timely as volatility spiked on account of the Reddit frenzy.
Read MoreJan 6, 2021 - In this article, we look at the volume, implied volatility of 10-Year options on futures from 2015 until now. We also analyze the quote size and liquidity of the underlying 10-Year futures. The analysis is timely as volatility dropped since the election whereas the first half of the year witnessed significant volatility. The year 2020 was unusual in many ways.
Read MoreOct 22, 2020 - In this paper, we look at the most traded symbol for several instruments across different exchanges to report the average daily quote size and liquidity of October 2020. We compare the same against the liquidity and quote size of last month as well as October 2019.
Read MoreAug 5, 2020 - In this paper, we use intraday trade and quotes of corn, wheat and soybeans futures to study the impact of WASDE on the market microstructure of futures.
Read MoreJul 27, 2020 - Markets have thawed in the last several weeks and this merits another look at the liquidity changes of the crude and brent oil futures.
Read MoreApr 23, 2020 - Using intraday data from January 2020 until now, we analyze the liquidity of the most traded contract of several energy futures listed on ICE and CME.
Read MoreMar 4, 2020 - Given recent volatility in the markets due to the coronavirus situation, we have examined the quote size of e-mini S&P 500 futures (exchange symbol ES) from 2012 until now.
Read MoreFeb 3, 2020 - We use intraday data from November 2019 until January 2020, we analyze the liquidity of the most traded Gas oil contract traded on ICE (exchange symbol G).
Read MoreOct 8, 2019 - We use intraday data from January 2018 until now to analyze the changes in market microstructure of U.S. Cash Treasuries.
Read MoreSep 20, 2019 - Using intra-day data around the recent US crude oil spike in prices, we show changes in the market microstructure after Saudi attack on September 14th disrupted global supply in crude oil.
Read MoreMay 16, 2019 - Based on our QB Roll Tracker, the 2-Year future has already rolled around 15% from TUM9 to TUU9 days before the roll period started.
Read MoreApr 4, 2019 - We examine the liquidity profiles of e-mini S&P 500 futures (exchange symbol ES) from 2012–2018 and show differences between our two measures of liquidity.
Read MoreFeb 26, 2019 - Determination of the CTD security is important for the shorts as they would be subject to deliver the security.
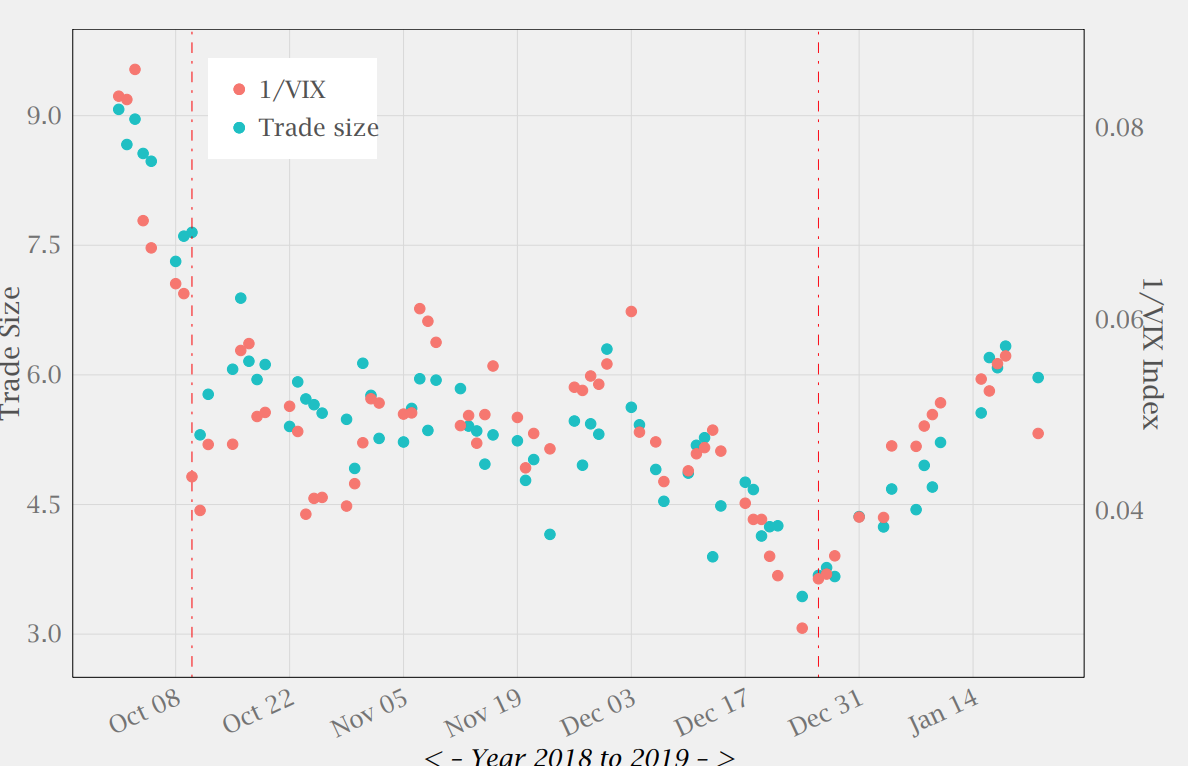
Read MoreFeb 1, 2019 - Using intraday data from October 2018 till now, we examine the liquidity profiles of e-mini S&P 500 futures (exchange symbol ES) and compare the same against VIX
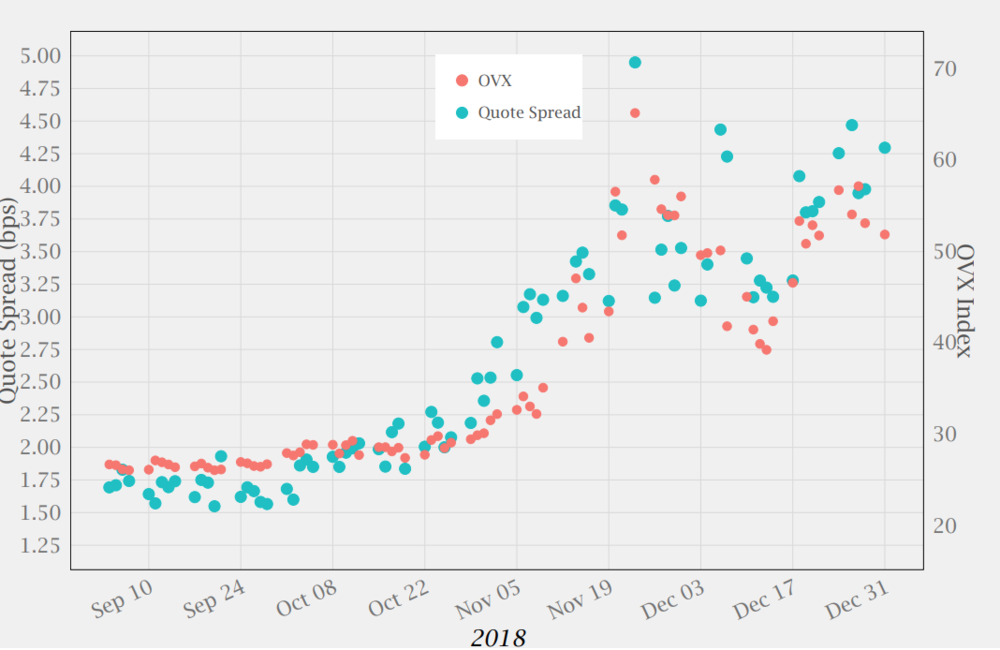
Read MoreJan 7, 2019 - We have expanded our research using intraday data since September 2018 to compare liquidity changes for the following products: Oil VIX Index (OVX), NYMEX Crude Oil futures (CL), Natural Gas futures (NG), Heating Oil futures (HO) and RBOB Gasoline Oil futures (RBOB) since September 2018.
Read More


